The Japanese life insurance industry has annual sales (≒ premium income) of 43 trillion yen, and its market size is large compared to other industries.
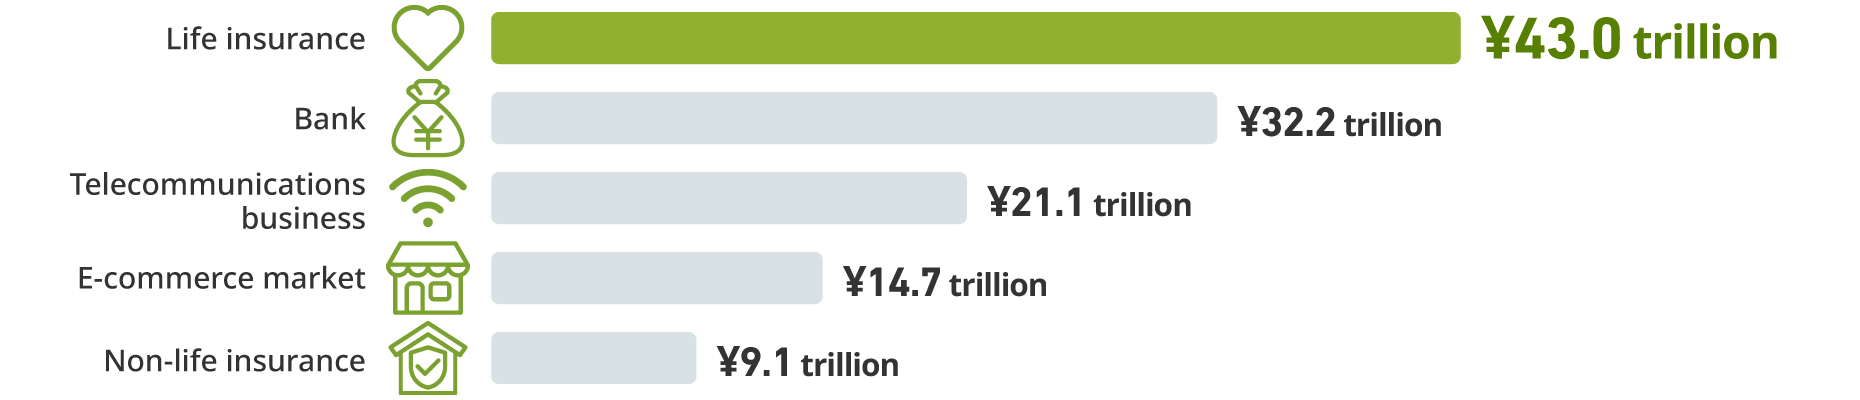
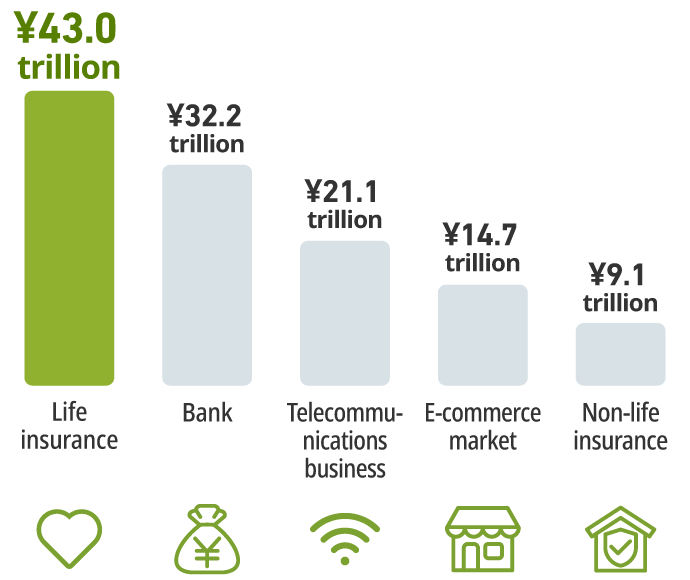
- Life insurance is premium income, banks are ordinary income, telecommunications is sales, EC is BtoC EC market size (merchandise sales) transaction value, and non-life insurance is net premium written. General Insurance Association of Japan "Life Insurance Business Overview Annual Statistics" (2024), Ministry of Finance "Corporate Enterprise Statistics Survey" (2022), Ministry of Internal Affairs and Communications Information and Communications Bureau "2023 Information and Communications Industry Basic Survey" (2022 results), Ministry of Economy, Trade and Industry "Market Research on Electronic Commerce" (2025), General Insurance Association of Japan "Data by Insurance Category" (2023)
In Japan, life insurance boasts a high subscription rate of about 90% per household and 200 million contracts due to its high public nature as a social infrastructure. While it is a mature market, there is a recent trend of lower life insurance subscription rates (uninsured) among younger generations due to financial reasons and a lack of understanding of life insurance.
Life insurance subscription rate1
(households)
89.2%
Number of policies-in-force2
(end of FY2023)
195.30 million
Number of new policies2
(FY2023)
12.4 million
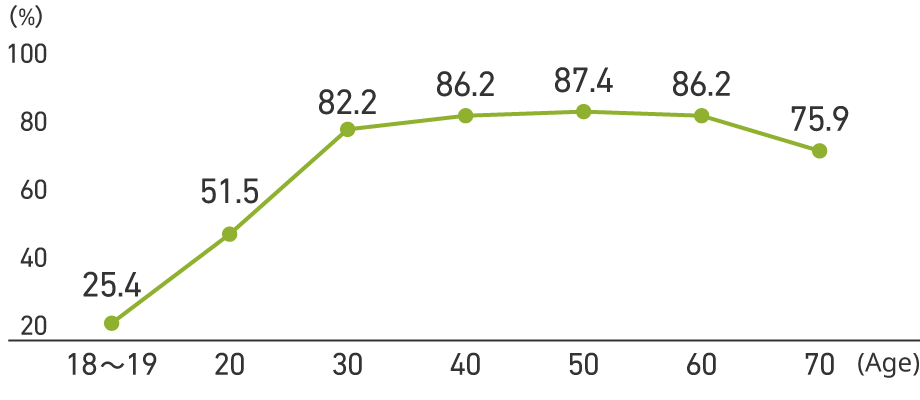
Despite needing life insurance for life events, young adults have low subscription rates.
| (20s) | (30s) |
| 51.5% | 82.2% |
Life insurance subscription rate by age group3
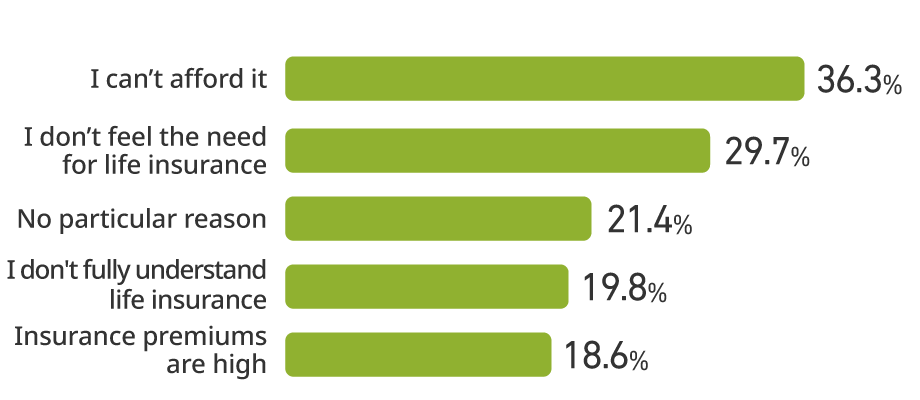
Reasons for low life insurance enrollment among young people
● 1 out of 3 non-subscribers cite "financial reasons"
● Issues with understanding the necessity of life insurance
Reasons for non-subscription to life Insurance (20s to 30s)3
- *1 Japan Institute of Life Insurance "National Survey on the Actual Conditions of Life Insurance" (2024)
- *2 The Life Insurance Association of Japan "Life Insurance Business Overview Annual Statistics" (2024)
- *3 Japan Institute of Life Insurance "Survey on Life Protection (2022)"
The percentage of people subscribing to life insurance through insurance company sales representatives has been high for a long time, but customer needs for subscription channels are diversifying, with online channels and insurance agencies among the channels they would like to use in the future.
Past and future trends in life insurance subscription channels*1
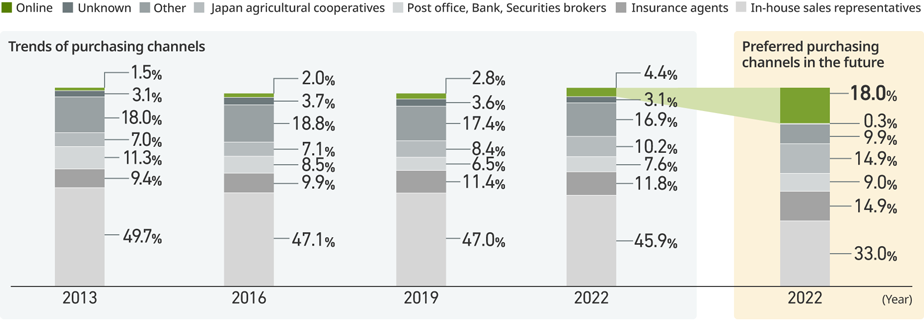
- The Japan Institute of Life Insurance "Survey on Life Protection"
* Source: Survey on Life Protection by the Japan Institute of Life Insurance
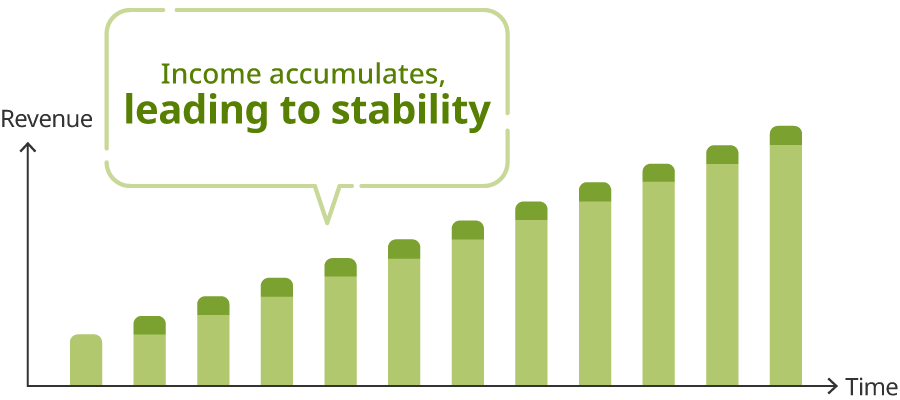
Life insurance is a subscription-type business that continuously collects premiums from customers who have signed up for extended periods of time.
We consider life insurance to be a recurring revenue business because it has a solid business base and stable operations that are resilient to external factors, exhibits revenue growth as the number of policies increases, and is subject to low cancellation and lapse rates due to its highly public nature.
Stock business (ex. insurance, information and communications)
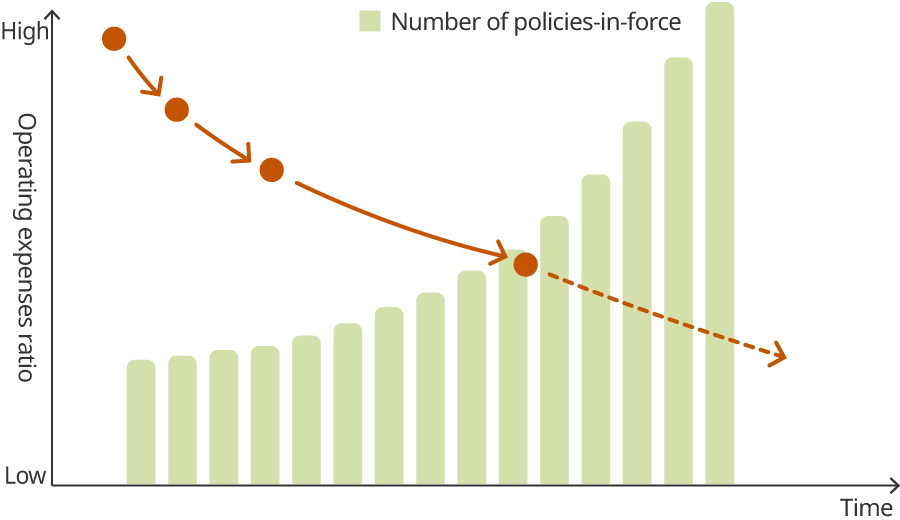
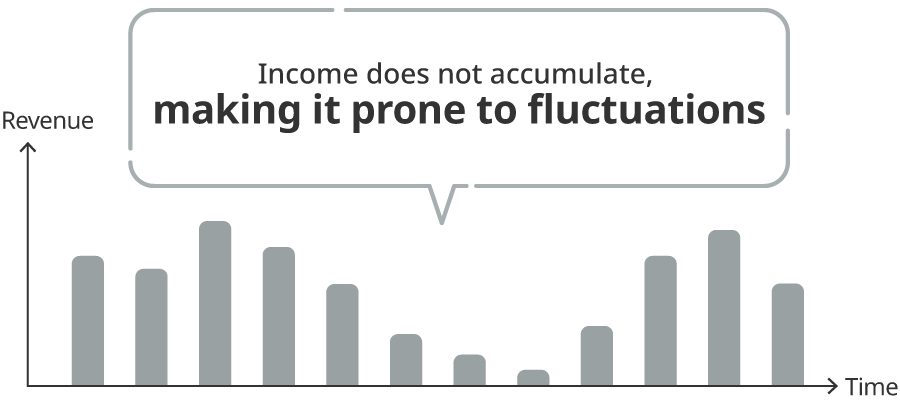
Flow business (ex. restaurants, retail)
Life insurance companies, due to being in the "capital-intensive industry," require very large initial investments, such as large-scale equipment investment in the early stages of establishment. On the other hand, one of the characteristics of life insurance companies is that as the number of contracts held accumulates and the scale of the business expands, it becomes possible to reduce the unit cost per contract and conduct efficient business operations that take advantage of economies of scale.